











































Mean radius and how to think about it

_Shorty

CGN Regular
Rating - 100%
1   0   0
Location
Vancouver Island
MREviz announcement post screenshot.png

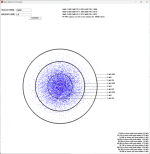
Mean radius seems to be easily misunderstood. I wrote a small Windows application that will hopefully help illustrate what MR means, and more importantly, show you how much of an error window there is when talking about a given number of shots.

You can get the application here:
https://github.com/ShortyCM/MREviz/releases

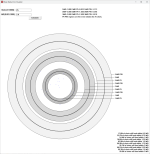
You can enter any number of shots from 2-10000 and enter a particular mean radius. The app will then calculate the P5-P95 error window for you and display how that relates to the mean radius in question. You will see three dark circles representing the mean radius you have entered, shown as 1 MR, as well as 2 times that MR (2 MR) and 3 times that (3 MR). There are also some shaded regions around that which outline the error window region that surrounds each MR value. That error window region shrinks as you add more and more shots, so that you can get an indication of how precise an answer you're getting with having measured a given number of shots.

There are three lines at the top that show you 1MR, 2 MR, and 3MR values related to the MR that you input. And it also shows the corresponding P5 and P95 values for each error window. In the screenshot it shows 25 shots have been entered with a MR of 1.0, and it says the P5 value for 1MR is 0.833 and the P95 value is 1.173. What this means is that for your measured mean radius of 1.0, say 1.0 MOA, the error window for 25 shots is 0.833 MOA to 1.173 MOA. So while you measured a mean radius of 1.0 MOA for those 25 shots, the fact that there is only 25 shots in the dataset means the actual mean radius value lies somewhere between 0.833 MOA and 1.173 MOA. With fewer shots that error window would be larger, and with more shots the error window would be smaller. And playing with the input values in the application will let you see how the number of shots changes those error window regions.

I also included what percentage of shots will land in given fractional multiples of the MR at the lower right of the window. This is to give you a better idea of how to think about mean radius in general. Mean radius is a predictive value. It tells you what you can expect to see in the dispersion on target. I think the most basic way to think about it is, for a target of any given size, you will want a mean radius of half its size in order to have more than 95% of your shots hit the target. As you can see in the list, for a given MR, you can expect 95.7% of shots to hit inside a circle that is twice that MR value. Those values are simply derived from the Rayleigh distribution, which you can also think of as a circular-normal distribution. A "normal distribution" with one dimension is the classic bell curve most people know about. A "Rayleigh distribution" or "circular-normal distribution" is a normal distribution with two dimensions, an x and y axis in this case. A typical bell curve in the x axis and a typical bell curve in the y axis combine to give you the Rayleigh/circular-normal distribution. And that's what gives these percentages for these fractional multiples of the MR.
 
As I understand it if I shoot a ten shot group and get a group size measurement that number is an extremely weak basis for predicting future outcomes, It might be zero for all I know. But if I enter the distance to center for each shot Shorty's program (I use OnTarget TDS) calculates the MR which does have statistical significance that can be used predictively.

Since I shoot for score I measure from target center. Shooting for score is a different beast than shooting groups. Foremost it requires trying to get a handle on wind and mirage in order to hit target center rather than simply allowing the group to form where ever conditions dictate.

Question for Shorty ... I guess a group shooter just allows the "target center" to default to each individual groups centers where ever that arbitrarily drifts to.
 
If you punch in one of your previous MR measurements and input 10 shots this will show you how much error there actually is in that measurement due to the 10-shot nature of it. The figures listed at the bottom right is how mean radius predicts performance of future shots. But the important thing to remember is your MR measurement contains error. And this shows you how large that error window is based on how many shots you enter. Inputting 10 shots will show you a pretty large error window. The real answer could be as small as the P5 border or as large as the P95 border.

As for benchrest group shooting, I would imagine they still try to find the calmest conditions to take their shots. They don’t care where the centre is, true, but they still want all shots as close to centre as possible. But it is the same for all of us. We want shots as close to where we want them as we can get them, and that means paying attention to conditions.
 
OnTarget TDS calculates the Group CEP(circular error probability). It looks like the same thing as your numbers.

Can you shed any light on this one?

The Lapua testing centers in the US plot a bar diagram of how many rounds scored at increasing distances from center on the ISSF?(doesn't matter to my question) target. Never is there a nice Gaussian distribution ... the inside/center is always under populated. What gives?
 
MR and CEP are similar. They're both stated as the radius of a circle. MR is the easiest to measure, as it is just the mean radius of all measured shots. And the way the math works, a circle with that radius would contain 54.4% of all shots fired. With CEP, it isn't as straight forward to measure because you kind of have to work backwards to get the answer. With CEP you are talking about the radius of a circle that would contain 50% of the shots. OnTarget lists this as CEP50 to make it obvious that they're talking about a circle that contains 50% of shots, since they also list CEP90 and CEP95, which would be the radius of circles that would contain 90% and 95% of all shots, respectively. RM and CEP are both related to the same Rayleigh-type distributions. They're just different ways of expressing it. The MR can be directly measured. But CEP requires you do some more math to figure it out. For a single group of shots they're all describing different subsets of the same Rayleigh distribution. It can be nice to know the CEP90 and CEP95 values because it saves you having to work it out yourself from MR. Even just doubling MR takes a bit of mental work. It's pretty close to CEP95, though, since 2MR is 95.7%. So if it is already displaying CEP95 it saves you having to even think about it.

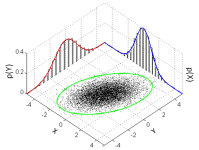
The distribution is Guassian, but remember, it is in two dimensions. The x axis is Guassian, and the y axis is Gaussian, separately from each other. So when you combine the two you get another type of distribution, a bivariate normal distribution. This example graph from wikipedia isn't circular because it's actually talking about a different kind of equation, but it should still give you the gist of it. In this case they're not using the same scale for both x and y so it shows up as an ellipse. For our shooting purposes it would be the same for both x and y, and would show up as a circle. (Unless you want to get more technical/thorough and start talking about gravity preload on the barrel, whole-firearm CoG versus recoil, tuners, etc., and then we would end up with an ellipse of some sort.)

1779941844070.png

But the reason this isn't most densely populated right in the very centre is because when one axis is randomly right near 0 the other axis probably isn't. But as I say, if you isolate a single axis and look at it then it would indeed be Gaussian on its own.

1779942207875.png
 
Back
Top Bottom