If I may summarize, using Toolman's evidence from his post #28:
As I mentioned in my post #11 above, the correct scientific method answer to Grauhanen's original question of "What should a tuner be expected to do?" is, first and foremost, the null hypothesis.
Null hypothesis: Expect nothing. (or re-worded: Tuners have no effect on group size and shape, or precision and accuracy.)
You then try to disprove, or falsify the null hypothesis. You test using methods to control variables, etc, etc. You can falsify it only with repeatable results that show it is not true, i.e. you discovered an effect that is measurable and repeatable.
In Toolman's post #28, and taking him at his word that his data generation has been large enough, Toolman can confidently say: The null hypothesis is now falsified and rejected. The repeatable evidence shows that my tuner does have a measurable effect.
Toolman's new working hypothesis is: My tuner reduces vertical spread by on average 0.118" at 50m/yards (using the example data, as a simple example shown in post #28. I know Toolman's actual data set is large and the stats would be different with the larger data set).
A "working hypothesis" can be converted to a "theory" when the shooting results are repeated enough times that the confidence is very strong. That confidence is achieved statistically when you see the normal distribution bell curve forms. I will take Toolman at his word when he says he has enough replicate data, and so he likely has achieved that normal distribution of results. The new theory is strong for his rifle and ammo.
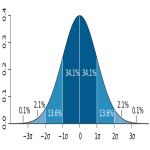
The Normal Distribution, from Wikipedia, link:
https://en.wikipedia.org/wiki/Normal_distribution
Diagram of simple symmetrical Normal Distribution (from free to share, public domain, Creative Commons Attribution. author: M.W. Toews), link:

Quote from Wikipedia: "For the normal distribution, the values less than one standard deviation away from the mean account for 68.27% of the set; while two standard deviations from the mean account for 95.45%; and three standard deviations account for 99.73%"
What those SD values are depends on Toolman's larger real life data set.
The shape of the normal distribution and numerical quantity of those SD's on either side of the mean lie at the heart of the OP question for expectations for what the tuner is expected to do.
In Toolman's case, (and I believe him), the expanded answer to the OP question is (using the simple example data): My tuner is expected to reduce vertical on average by 0.118", with one SD of X (where X would be generated from his larger data set).
Note that with the normal distribution, that 2 SD's amount (< 95.45% of the time) means that the hit location for some rounds will be approaching zero difference, for about 5% ish of the time. In a rimfire match standard of 25 round mini bulls, 5% of 25 rounds is 1.25 rounds. That means, on average, about one round in the 25-round match will have very little to no measurable effect by the tuner. However, that is actually quite good odds for using the tuner to win the match.
")