What should a tuner be expected to do?


Thanks JEDelta for that effort. That is alot of work, and expense too, so it is appreciated.

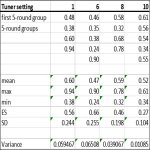
I am not a stats guy, and I just mess around with stats. (For serious work I would hire a stats professional). On first glance at the resulting means (averages) of your replicates of your 5-shot groups for tuner settings 1,6,8,10, I suspected that these means might not be statistically "significantly different", i.e. the range of means from 0.47 to 0.60, given the size of the ES and SD's (see augmented table below) indicates that there is alot of overlap of distributions.

Excel has a handy ANOVA tool to test for significant difference in the means of multiple sample groups.
(For help on ANOVA, this video shows a simple example how-to in Excel, including how to add-in the stats analysis tools that are in Excel:
https://www.youtube.com/watch?v=ZvfO7-J5u34

We can use this to test our null hypothesis that the tuner has no effect on the mean group size. The alternative hypothesis is that the means are significantly different and therefore the tuner does cause a significant difference in the groups. But to accept the alternative hypothesis we must first falsify the null hypothesis.

Table 1 below is the copied data for the 5-shot group replicates for tuner settings 1,6,8,10, with added ES, SD and Variance:

Tuner_Stats_Table-01.jpg

CAVEAT: By rules of statistics, the sample sizes here per tuner setting are not large enough for a robust test. Technically we cannot know if these means are really different or not. For a strong confident test, we would need a minimum of 30 replicates per tuner setting. I know, I know, that is a huge effort and expense! :) So given the caveat that the test shown below is not robust, let's proceed just for fun to see what shakes out from the ANOVA.

The standard significance threshold is P <= 0.05, so I used that in the test.

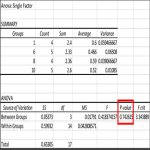
Table 2 below is the ANOVA output from Excel:

Tuner_Stats_ANOVA_resize-01.jpg

The P value = 0.74. That is huge, not <= 0.05. This indicates that the tuner setting means (averages) are not significantly different. Therefore we cannot reject the null hypothesis. i.e.: The mean group sizes are not significantly different.

HOWEVER.....statistics can lie, or mislead. (Mainly because the sample sizes are too small, or the wrong test for the given assumptions is chosen).

When we look at tuner setting 10 we can see what looks like a much smaller ES and SD. The group mean of tuner setting 6 (0.47) is smaller than tuner setting 10 (0.52). But setting 10's ES is more than twice as small as setting 6's ES. Based on the ES, I would chose tuner setting 10 in a match. In a match for score, I would much rather have that small 0.27 ES working in my favour.

But that said, more replicates of these settings could change the data and difference significantly.

Rimfire stats are slippery things, and everything changes with a new lot of ammo! :)
 

Attachments

  • Tuner_Stats_Table-01.jpg
    Tuner_Stats_Table-01.jpg
    53.7 KB · Views: 49
  • Tuner_Stats_ANOVA_resize-01.jpg
    Tuner_Stats_ANOVA_resize-01.jpg
    43.5 KB · Views: 50
CAVEAT: By rules of statistics, the sample sizes here per tuner setting are not large enough for a robust test. Technically we cannot know if these means are really different or not. For a strong confident test, we would need a minimum of 30 replicates per tuner setting. I know, I know, that is a huge effort and expense! :) So given the caveat that the test shown below is not robust, let's proceed just for fun to see what shakes out from the ANOVA.

Biologist, thanks for the data analysis! It's been way too long since I last used my stats courses from university. I think I need a refresher lol.
I think as many people have been saying, the issue is the ammo. If the tuner does provide a benefit, it is likely smaller than the variance in group size. And because the variance between groups is so large, an appropriate sample size to prove it would have to increase accordingly.

I've got some more ammo from this lot, but not quite enough to shoot 30 groups per setting :p

I'm going back to the range tomorrow. I was thinking of either shooting four, five round groups for all 10 tuner settings. Or 8 groups for tuner settings 6 and 10 and then 8 groups for 2, 4, and 8. While I don't think either of those tests will provide statistically significant outcomes, I think they should hopefully give more data that might help with the eyeball test.
 
If we are going to do serious statistical analysis, the first step is to collect proper data on the impact locations. Merely measuring ES of a group borders on useless. The proper way to do it is to measure the x,y coordinate of every impact, and do the analysis on that data.
 
If we are going to do serious statistical analysis, the first step is to collect proper data on the impact locations. Merely measuring ES of a group borders on useless. The proper way to do it is to measure the x,y coordinate of every impact, and do the analysis on that data.
Are you talking about measuring mean radius instead of group size?
 
Are you talking about measuring mean radius instead of group size?

As I mentioned, I am talking about measuring the horizontal and vertical position of every impact. Once that data is collected, it can be analyzed and put into algorithms to come up with the various representative values of the "precision."

As to the best choice of that representative value, I haven't done the research to figure that out. If we are shooting scored bullseye targets, then mean radius is probably best as it will translate very directly into a score. If we are shooting steel targets, extreme spread has merit, though mean radius still has value, so perhaps both should be considered.

Here's a target statistical analysis app and its precision values:
ExtendedTargetData_01.jpg


This site has a good list of the variety:
http://ballistipedia.com/index.php?title=Describing_Precision

I should also add that there exist simple mobile apps that turn a photo of a target into these representative values with minimal effort and cost. Admittedly I don't use them, so I can't recommend one. I've heard of Range Buddy and Ballistic-X.
 
As I mentioned, I am talking about measuring the horizontal and vertical position of every impact. Once that data is collected, it can be analyzed and put into algorithms to come up with the various representative values of the "precision."

As to the best choice of that representative value, I haven't done the research to figure that out. If we are shooting scored bullseye targets, then mean radius is probably best as it will translate very directly into a score. If we are shooting steel targets, extreme spread has merit, though mean radius still has value, so perhaps both should be considered.

Thanks for the explanation! I can definitely appreciate how different values could be more applicable to different shooting disciplines.
I'll run the calculators and come back with a mean radius for each group after my range trip today. I can see how it might be statistically more useful, each shot in the group provides data, rather than the two worst shots per group.
 
If we are going to do serious statistical analysis, the first step is to collect proper data on the impact locations. Merely measuring ES of a group borders on useless. The proper way to do it is to measure the x,y coordinate of every impact, and do the analysis on that data.

^^^^ Yes, agreed. However I have a minor point of clarification needed on "ES".

When you were referring to "ES of a group", did you mean the maximum axis distance measured on the impacts of two round's within a single group of several more rounds in the group, where all of the remaining impacts not in the maximum axis get ignored for their inherent dispersions? If so, then yes I agree with your meaning. To use only the maximum distance axis of a group is wasting most of the spatial dispersion characteristics of the group, and not describing the true 360 degree spatial outcomes on target.

I think that old classic measure of group "size" using the maximum axis and ignoring the rest of the impacts, was a product of the technology of the day, and practicality. Now with computer software that can do spatial analysis, (along with a person's time and mental energy requirements), a vast new world of better and more meaningful statistical analysis can be done.

When I use the term "ES" it refers to the max minus min value of a set of data, (any data), which is a measure of the numerical spread of that data set. Its not the distance measure of a group's impacts. ES is common and useful in many stats applications. I just wanted that clarified as a general statistics thing.

The spatial shape of the group, or the dispersion of rounds around the defined center of a scoring bull, also has a density that can be quantified in concentric polygons for any percentage. e.g. the inner 50% of hits averaged a mean radius of X%. The data set for all inner 50% mean radii in the sample can then be queried for the spread, i.e. the ES of the data.

With the new computer spatial analysis and statistical tools available, its a whole new world for understanding how tuners can affect dispersion and match scores.

Thank you for posting that link to Ballistipedia. I skimmed through it, and it looks like a fantastic resource. I plan to read through it.
 
Last edited:
Not really related to the current discussion but here is my target from today tuning my rifle. The gun is an Anschutz 2007/2013 in a BR stock with a Lowey tuner, 36X Leupold, and shooting Tenex. It’s clear to see that the tuner has an effect on group size. (The pics of the rifle are from a previous range session hence the Midas+ ammo)

hnjVqu4.jpg

O3UhNVG.jpg

hb66ur4.jpg


What would be more interesting is if after this test, you took one of the "best" tuner settings, and shot a bunch of groups. Then set the tuner to the "worst" setting, and shoot another bunch of groups. From there compare the aggregates and see if there's actually any meaningful statistical difference in group size.

That would be much more compelling.

In my experience that should actually be pretty easy to do... I had a Redknob on a rimfire last year and I could get CX and SK match to shoot maybe a couple percent tighter then without it, but I could also make it shoot wildly worse very easily! I feel that it also liked a different setting at different ranges etc..
 
What would be more interesting is if after this test, you took one of the "best" tuner settings, and shot a bunch of groups. Then set the tuner to the "worst" setting, and shoot another bunch of groups. From there compare the aggregates and see if there's actually any meaningful statistical difference in group size.

That would be much more compelling.


Perhaps even more interesting and useful would be a first step of accumulating a substantial amount of data concerning how the rifle and ammo performed without a tuner. It's imperative to know how the rifle and ammo shoots before a tuner is included in the equation. A few groups are never sufficient.

A second step is to generate a sufficient amount of data at various tuner settings. This can be time consuming and expensive, not to mention fruitless without good ammo. A few groups are never sufficient.

Compare the non-tuner data with a substantial amount of data of what is ostensibly the "best" tuner setting.

A problem with many supposed tuner tests is that it the data is inadequate to draw meaningful conclusions. Another equally important problem is when the ammo, regardless of its grade, is insufficiently consistent to produce reliable results.

_________________________________


Is it possible that the basic purpose of the tuner is in danger of becoming forgotten if the results on targets must be subjected to "serious" or "spatial" analysis, potentially with algorithms, to understand how tuners affect dispersion?

When using consistent ammo and when it is working as it should, a tuner should be expected to slightly shrink groups or improve results on scored targets. If you can't tell that a "best" tuner setting is working, get one or more of the following: more testing, better ammo, a better rifle, a better rifle/bench set up.

For the record, in regards to my testing, I’m working with a limited amount of ammo from the same lot and I plan on using it in upcoming matches so I don’t want to use it all up with unnecessary testing. My goal was to find the best setting and then leave that lot of ammo for my upcoming matches. In the future, I will be doing some serious lot testing and plan on buying MULTIPLE cases of that lot if I find a superb batch. And, if I don’t find an acceptable lot, I will re-barrel my rifle, and start over. Then with that ammo, I will be doing more testing and experimenting.
 
Did a bit more testing today. Pretty similar conditions to Saturday, same temp and wind conditions within a couple degrees and a few km. Same setup as before CZ 457 MTR, Tuna Can Tuner, SK LRM.
I cleaned the rifle, so I did the same 20 fouling and warm-up shots.

I picked five tuner settings. 2,4,6,8 and 10. I opted to use fewer settings to increase the number of groups per setting. I fired one five-shot group per setting, starting from 2 and going up to 10, and then restarting at 2. I repeated this process until I had eight groups per tuner setting. I feel like shooting this way made sense, because it took me about an hour and a half to shoot all the groups, that way each tuner setting has a consistent spread of conditions throughout the total round count.
Originally I tried to use the Hornady app to measure the group size and mean radius, but I found the results to be a bit too inconsistent. Instead, I downloaded the OnTarget Precision Calculator and scanned the target. This led to a much more consistent measurement of group sizes, using the calipers for comparison.

I'm not sure if I am missing anything here, but the group size results appear to be pretty close to statistically significant p < 0.05, and the results are definitely significant when the outlier groups are removed.
With the caliper measurements, the results are quite similar. p=0.074877 for the whole data set, and p = 0.020222 for the data with the outliers removed.

The mean radius results aren't as strong but definitely look promising.

Setting 10 was a repeat performer from Saturday, and it would have been the winner if not for setting 4, which was not tested in any real way on Saturday.

Here is all the data
Data All.jpg

Here is the data with the highest and lowest groups of each setting removed. (Outliers if you want to call them that)
Data Outliers Removed.jpg

Ignore the numbers written on the target. These were the original Hornady numbers, which I did not use. The only shot I didn't count is marked with a blue x in pen, I visibly watched myself jerk the trigger. I fired a total of six shots at that POA and crossed the "pulled" shot immediately after the group was completed.
Combined Target.jpg
 

Attachments

  • Data All.jpg
    Data All.jpg
    96.4 KB · Views: 65
  • Data Outliers Removed.jpg
    Data Outliers Removed.jpg
    93.3 KB · Views: 62
  • Combined Target.jpg
    Combined Target.jpg
    97.2 KB · Views: 64
Last edited:
JEDelta: Nice work!

It appears in Post #155 from your latest tuner testing and stats analysis, that the different tuner settings did produce significantly different mean group sizes amongst the settings, (using the longest axis between holes measurement method). The tuner settings do appear to be making a difference in this sample. Well done!

However across all the tuner settings for the ANOVA, we don't know if at least two of the groups and variance might be the same (not significantly different).
In the group size stats, I noticed that tuner settings 4 and 10 had the smallest means, and the smallest SD's, and at face value seem to be the two best IMO. I wondered if these two might be not significantly different? So I tested those two data sets with ANOVA, and sure enough, the P value = 0.286, (not <=0.05, therefore not significantly different).

Therefore, the tuner settings 4 and 10 compared against each other produced not different results, but both of these appear to be significantly smaller than the whole set of tuner settings (although I did not do exhaustive pair-wise tests). Tuner settings 4 and 10 I think are your two best tuner settings according to this data set for group size.

Regarding mean radius:
The mean radius analysis shows no significant differences in this sample as you demonstrated. I did notice that tuner setting 6 has the largest mean, and it looks to have roughly double the SD in mean radius (0.075) compared to SD for setting 4 (0.036). I bet if you run an ANOVA for 4 and 6 for mean radius, you might see a significant difference?


Re: Outliers or extremes: I suggest not removing the high and low outliers of the data (groups size, or mean radius). I think that data is too valuable to lose, especially since the sample is still relatively small by the stats textbooks. Its so small that I doubt the distribution is truly "normally distributed", and therefore we are stretching the credibility of this stats test. We do it anyway because we assume confidently that with a large enough sample size, the impacts on paper will form a normal distribution.

This is where the SD's come in for interpretation. The SD's in the fully populated sample already have that variation built into them, in the same units. For example in the group sizes, tuner setting 6 had that big ES, and its SD is huge (0.218) compared to the SD for setting 4 (0.080). Interp-wise that means 64.2% of the variation (1 SD of 34.1% each side of the mean, or 2x the 1 SD) is within 0.16 inches for tuner setting 4, versus 0.436 inches for tuner setting 6. That is enough contrast to be confident that on average, tuner setting 4 will beat tuner setting 6 in a match. That full data set with the extremes is your friend in the analysis, and better flags the likelihood of poorer or better score probability in a match.

Again, awesome effort in shooting that test and recording and testing all that data!

Thanks! The goal was to show statistically significant differences in group sizes between tuner settings, which the test appears to have done so.

I appreciate the second set of eyes on the data, as well as a sanity check. Some of this stats stuff is coming back to me, but it sounds like you might have a bit more experience with it :p

Individually most of the data sets are not statistically significant when compared in pairs. However when comparing the best setting to the #1 and #2 worst settings, the difference is significant (or very close to it), and vice versa.
6 and 10 p = 0.072624
6 and 4 p = 0.014723
4 and 2 p = 0.0513037

The ANOVA for 4 and 6 for mean radius results in p = 0.058263 which appears to be significant.

It's also important to take into consideration that the adjustments have been rather coarse, using only half the settings from 1-10. There is a possibility that one of the odd-numbered settings would have been even better or worse than the even-numbered settings, which could potentially give even stronger results.
However, an important part of testing is going to be repeatability. I've still got a few boxes of ammo from this lot, so I am going to try replicating some of the results on Saturday. Since I'm not too attached to this lot of ammo, I think it is more useful to try and replicate the results with the data I have, rather than try and find the absolute best setting. I'll save that for ammo that shoots a bit better.

Based on the results, I will try 12 groups each on setting 4 and 6. That should give the best opportunity to get good results. I think after that, I am going to take the tuner off and shoot 12 groups.
This should hopefully confirm the results of the previous tests, and maybe give an idea of tuned vs unturned.
 
I spent entirely too much time last night watching tuner and tuner related videos.

DQmUxU2.jpg


This video purports to show one in action, shrinking groups, with almost no effort or ammo expended, at 200yards, in a "considerable wind". The wind isn't really shown, nor are all the previous shots on this rifle he might have taken to determine best and worst settings.

https://www.youtube.com/watch?v=iKn6zjIJjZE
 
I spent entirely too much time last night watching tuner and tuner related videos.

This video purports to show one in action, shrinking groups, with almost no effort or ammo expended, at 200yards, in a "considerable wind". The wind isn't really shown, nor are all the previous shots on this rifle he might have taken to determine best and worst settings.

https://www.youtube.com/watch?v=iKn6zjIJjZE

After watching the linked video, it's obvious you spent at least 9 minutes longer than was useful in watching these kinds of videos. It's time no one can ever get back.

Your skepticism about it seems quite justified. It's not clear what, if anything at all, the video shows.

The shooter/narrator (Chase Stroud?), describes conditions as "extremely windy" at the 200 yard distance and notes that winds change during the video. The viewer never sees any of the results downrange -- except for a blurry image of the target at the top left corner of the video.

The shooter appears to shoot several groups on a number of the very same flourescent orange target circles on the steel plate. It might contribute to uncertaintly when evaluating results later. In any case, he claims the best tuner setting produces groups that are "golf ball size" (see around 6:20) but the viewer never sees the results, as few of them as there are.

Interestingly, when shots don't go where expected, the shooter explains the results based on what the wind must have done to cause the unexpected POI. He does this without reference to any apparent means (such as wind flags) to actually gauge the wind. He doesn't take into account that even when conditions are more perfect, for various well-understood reasons .22LR bullets don't always go where expected.

There's an absence of information about previous testing of tuner settings. In other words, this test is presented in a vacuum. He says he will test again at 150 yards. This seems to suggest that he doesn't subscribe to positive compensation as the reason why tuners work. But that's neither here nor there.

It seems like this video is nothing more than content creation by an "influencer". There's nothing in this video except the implication that even in windy conditions tuners are an effective way to improve results at 200 yards, which may appear persuasive to inexperienced shooters. It's difficult to see any value in the video.
 
Back
Top Bottom