Overview of ES/SD Characteristics Between Lots
In general ES/SD figures are not the same throughout any variety of .22LR match ammo, including Lapua Midas, the variety tested here. This means
ES/SD varies between lots of the same ammo.

Just so you're aware, you wouldn't simply average each subset's individual SDs to get an SD of the entire dataset. An SD is already a specific kind of statistical number and you need to treat it a certain way to combine multiple SDs into a single representative SD. You'd also need the mean velocity for each subset, and you'd have to do something like this:
total round count = Subset round counts added together:
N = n1 + n2 + n3 + n4 + n5 + n6 + n7 + n8 + n9
subset round counts and means combined like so:
grand_mean =
(
n1*mean1
+ n2*mean2
+ n3*mean3
+ n4*mean4
+ n5*mean5
+ n6*mean6
+ n7*mean7
+ n8*mean8
+ n9*mean9
) / N
and then
overall SD =
sqrt(
(
(n1 - 1)*SD1^2 + n1*(mean1 - grand_mean)^2
+ (n2 - 1)*SD2^2 + n2*(mean2 - grand_mean)^2
+ (n3 - 1)*SD3^2 + n3*(mean3 - grand_mean)^2
+ (n4 - 1)*SD4^2 + n4*(mean4 - grand_mean)^2
+ (n5 - 1)*SD5^2 + n5*(mean5 - grand_mean)^2
+ (n6 - 1)*SD6^2 + n6*(mean6 - grand_mean)^2
+ (n7 - 1)*SD7^2 + n7*(mean7 - grand_mean)^2
+ (n8 - 1)*SD8^2 + n8*(mean8 - grand_mean)^2
+ (n9 - 1)*SD9^2 + n9*(mean9 - grand_mean)^2
)
/ (N - 1)
)
and that would give you an SD figure that takes all the subset values into account. While that might coincidentally land near 7.1, it probably wouldn't.
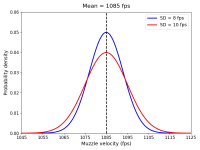
As for the subject at hand, chronograph statistics don't really predict precision on target very well because barrel harmonics and overall firearm physics affect what each shot ends up doing, even if we assume every bullet is identical, which of course they aren't. The shot velocity mean and SD tell you what you should expect for future shot velocities from that lot, as that's what those figures predict. It's a bell curve, and the mean and SD tell you the size and shape of the curve. (ES isn't involved in determining that size and shape, which is why people shouldn't really be looking at ES. ES just says "These are the two furthest samples seen so far." and that doesn't really tell you much about the size and shape of the bell curve in question. That's the job of the mean and SD.)
Where shots ultimately land is down to many variables, of which velocity is only one. And that velocity's importance is affected by the other variables. For example, if positive compensation or negative compensation is at play, or some unfortunate combination of the two. Shot velocity mean and SD would only predict points of impact if you had a perfectly static barrel, as well as perfectly identical bullets. Gun drilling and rifling a solid cubic metre block of steel to make a rather unwieldly "barrel" that doesn't really change shape while firing isn't very practical, though. And it would shoot like crap since it wouldn't change shape, resulting in shot velocity variance dictating elevation on target. In that unusual case you would most definitely see shot velocity SD predicting the dispersion on target, quite directly.
So is there any reason to examine shot velocity stats for lots of ammo? Well, it can be useful in some ways. It might be able to tell you whether or not a given lot is likely to stay within a known positive compensation window more often, for example. Better SD means narrower bell curve. Worse SD means wider bell curve. And, naturally, the narrower the bell curve, the more you have staying in the good region. Reducing the scale of the bad region is probably a good thing.